The size of shrinkflation, measured.
We cross-reference our database of 2,323 documented events against the government's official size-change tracker (the Bureau of Labor Statistics' R-CPI-SC index) and the Federal Reserve's Food-at-Home price index, so you can see whether brands are shrinking products on schedule with — or ahead of — official inflation.
products downsized last quarter
The Bureau of Labor Statistics' research index (called R-CPI-SC) counts every product the government tracks whose package quietly shrank between quarterly surveys. Q2 '26's count is +37.5% vs the previous quarter (+153.8% vs the same quarter last year). This is the most authoritative measure of US shrinkflation that exists, and we plot it alongside our own catch list below.
Shrinkflation tracks inflation
The single clearest pattern in the data: when food prices spike, packages shrink. When grocery inflation jumped to roughly 10% in 2022, the government's own count of food package downsizings more than doubled versus the year before — then receded as inflation cooled. It's why a fresh inflation print isn't just a number: it tends to be the starting gun for the next wave of smaller boxes.
Inflation, shrinkflation, and how they trade off
When grocery prices rise, brands face a choice — raise the price, shrink the package, or change the recipe. Plotting our documented shrink events (red) against the government's shrinkage count (blue dashed) and the Fed's grocery price index (amber) shows how the three move together.
The dollars-to-air conversion
Drop in your weekly grocery spend and see how much of every dollar is now just air in the bag — the dollar value of the food that's been removed from packages without the price changing. Built from actual size deltas, not estimates.
Built from 12 real products we've tracked across 2020–2026. Each item's package shrank by an average of −53.9% with no price drop — so a fraction of every grocery dollar buys nothing but air.
If your real basket looked like this one, the math below holds. The numbers assume even spend across the 12 products and use the size shrinkage as a proxy for the value you've lost. Your actual basket will differ — but the direction is the same.
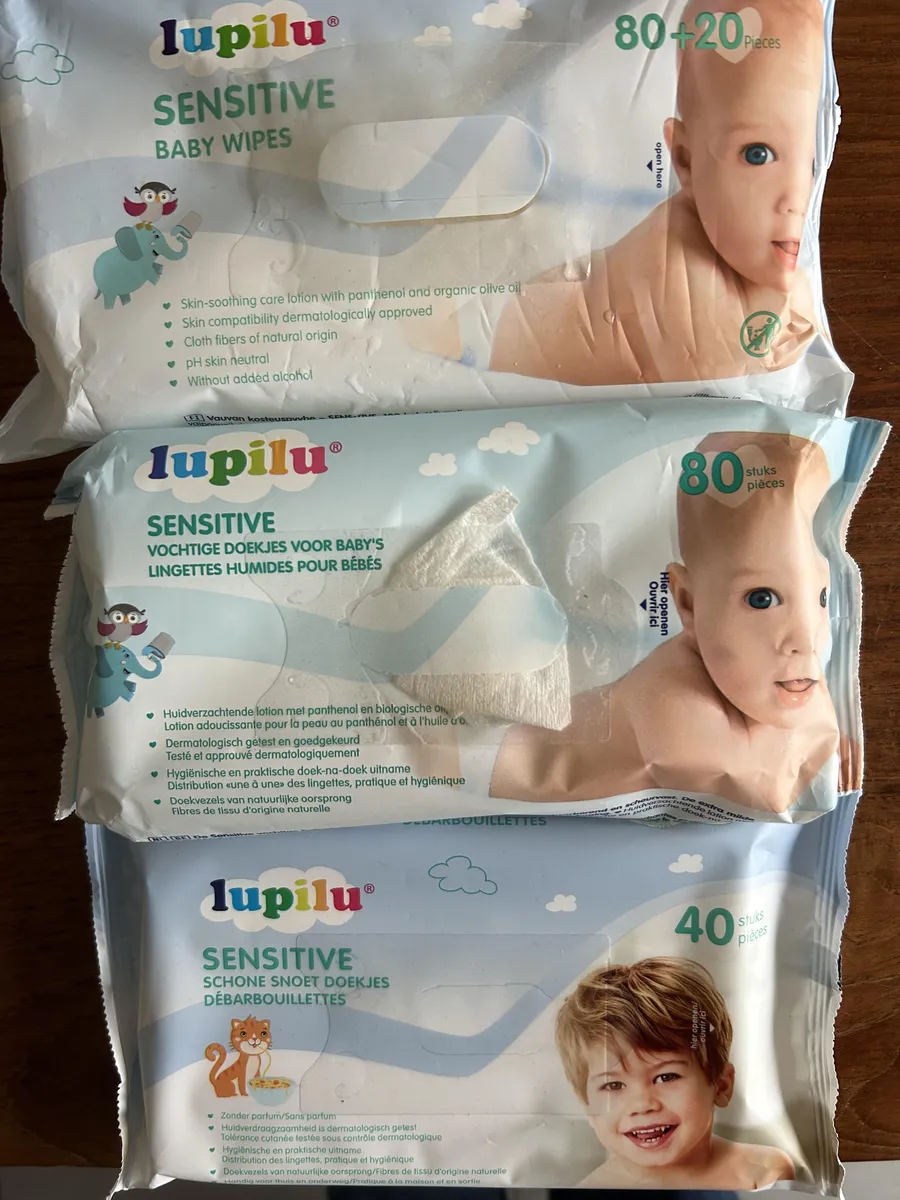
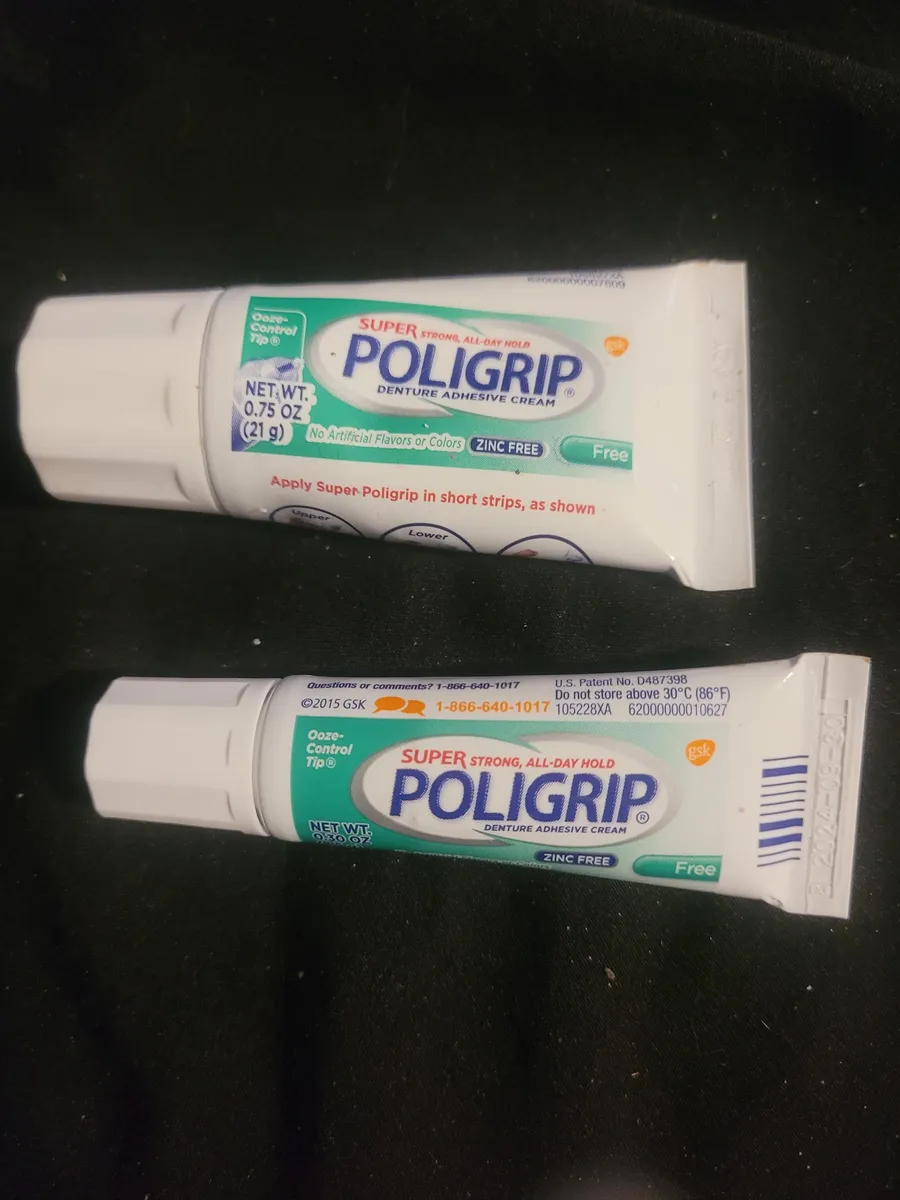
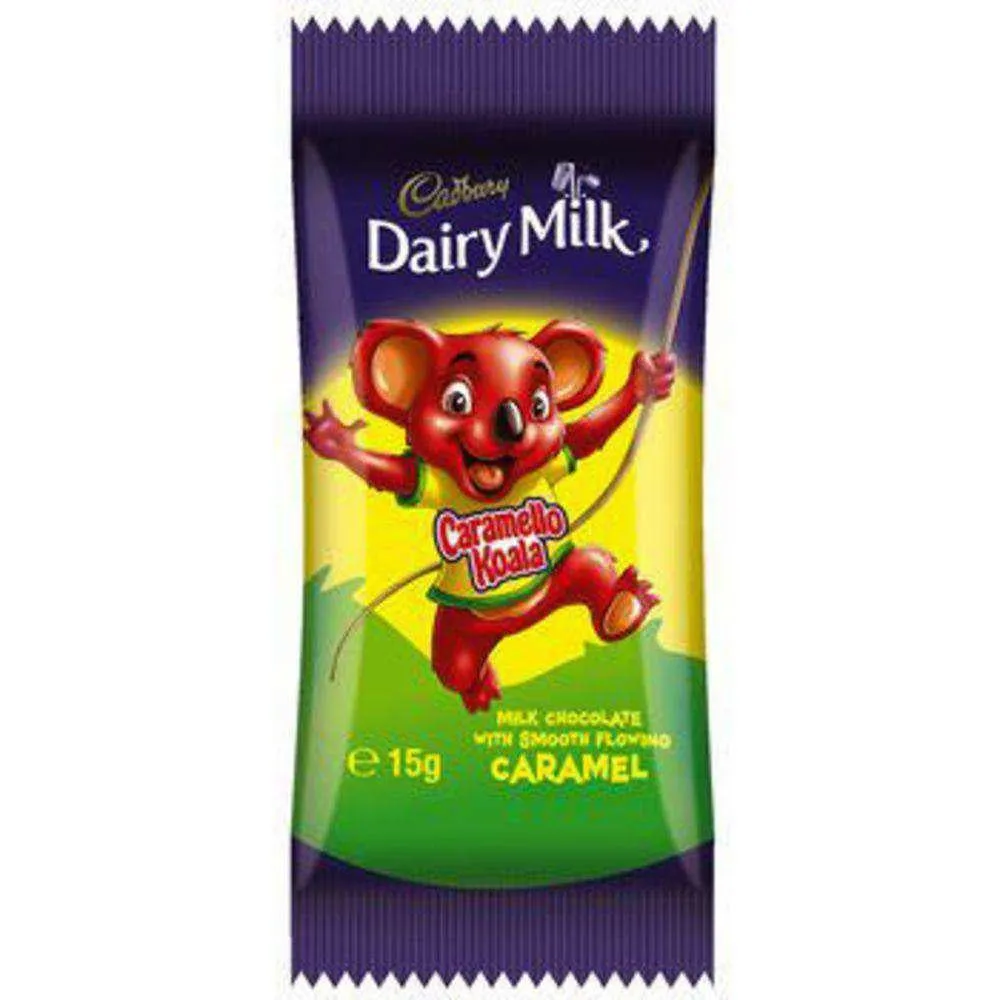
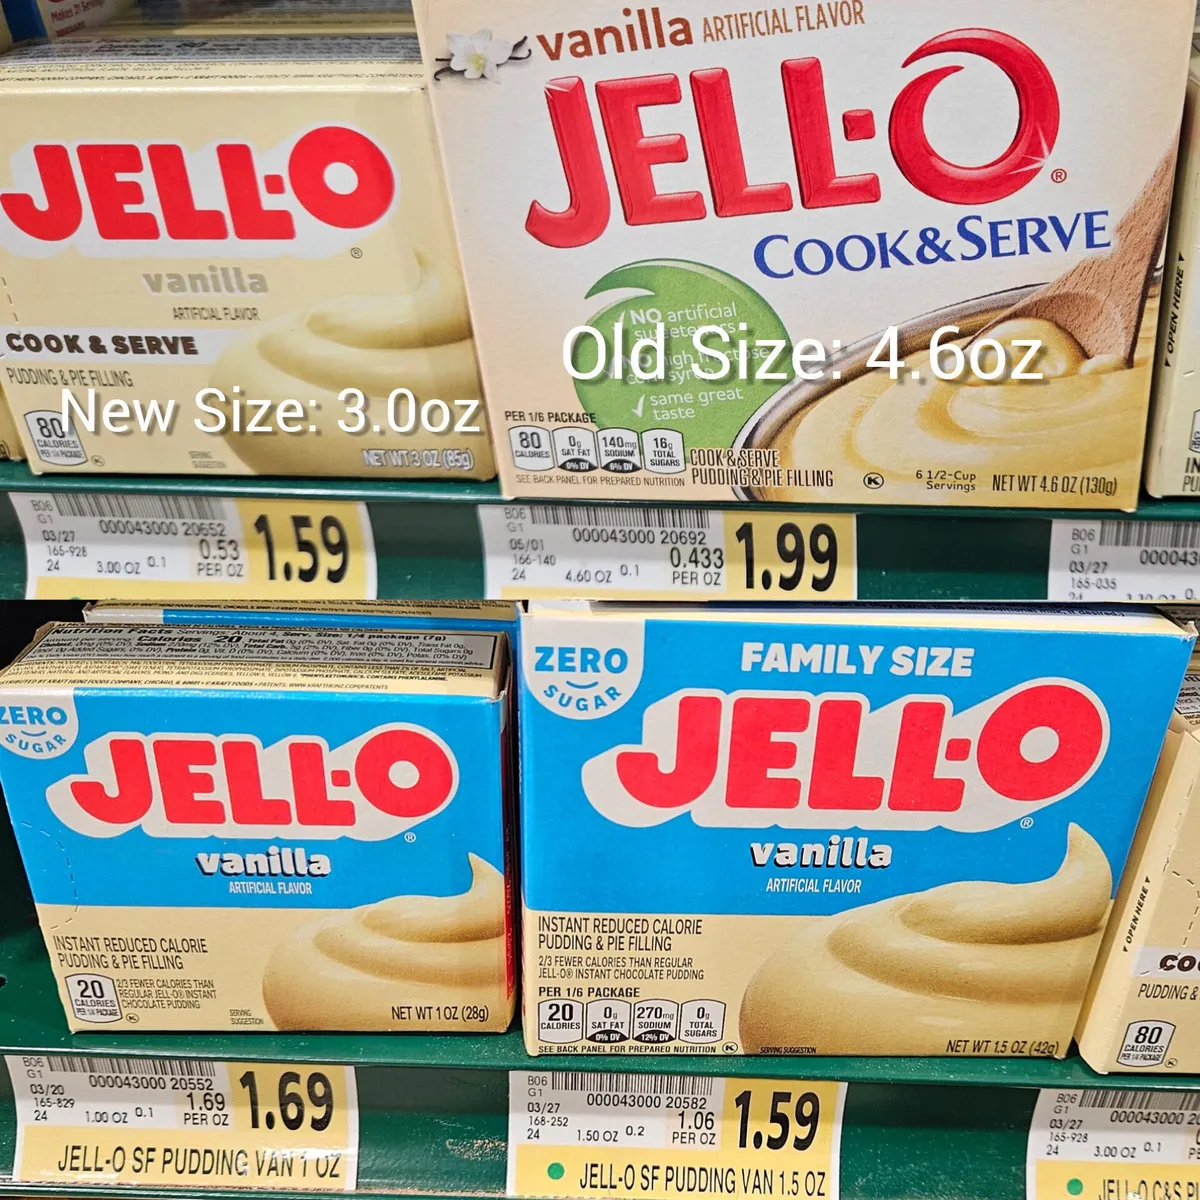

Which categories are getting hit hardest?
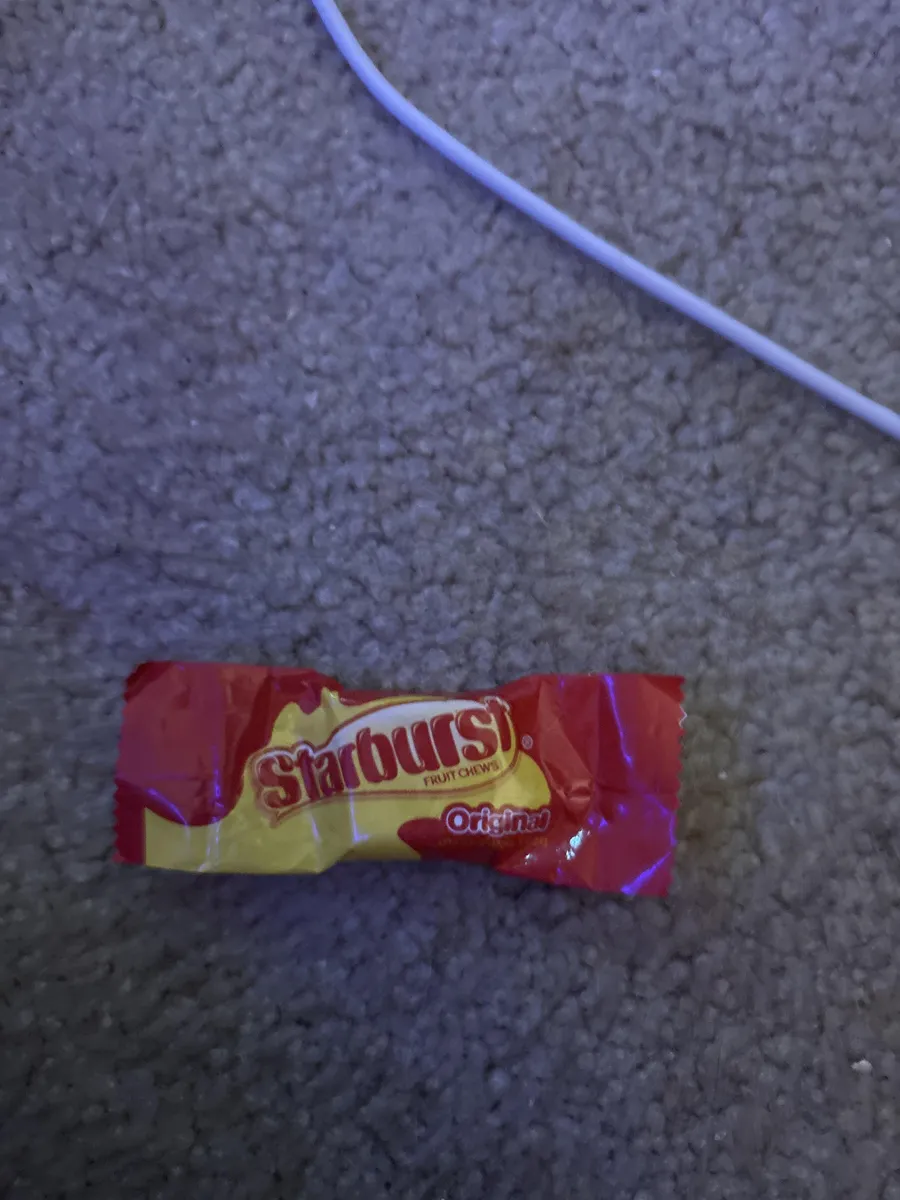
Snacks and confectionery typically dominate the list — small, repeatedly-purchased items where shaving a few grams off the bag is least noticeable to shoppers.
Skimpflation: when the recipe quietly changes
It's not just the bag getting smaller. Skimpflation is when brands swap ingredients to lower cost — less meat, more filler, less butter, more palm oil. We cross-reference USDA's quarterly FoodData Central releases to flag nutrition changes that look like ingredient substitution rather than reformulation for taste.


Who actually owns these brands?
Most shrinkflation isn't a small-brand story — it's decisions made at the corporate-parent level. We trace each brand back to its manufacturer via Wikidata so you can see the actual portfolio behind the shelf labels.



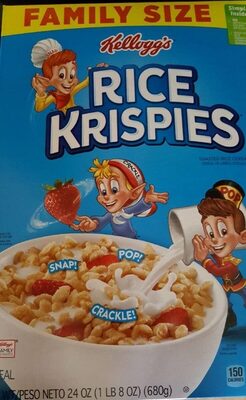
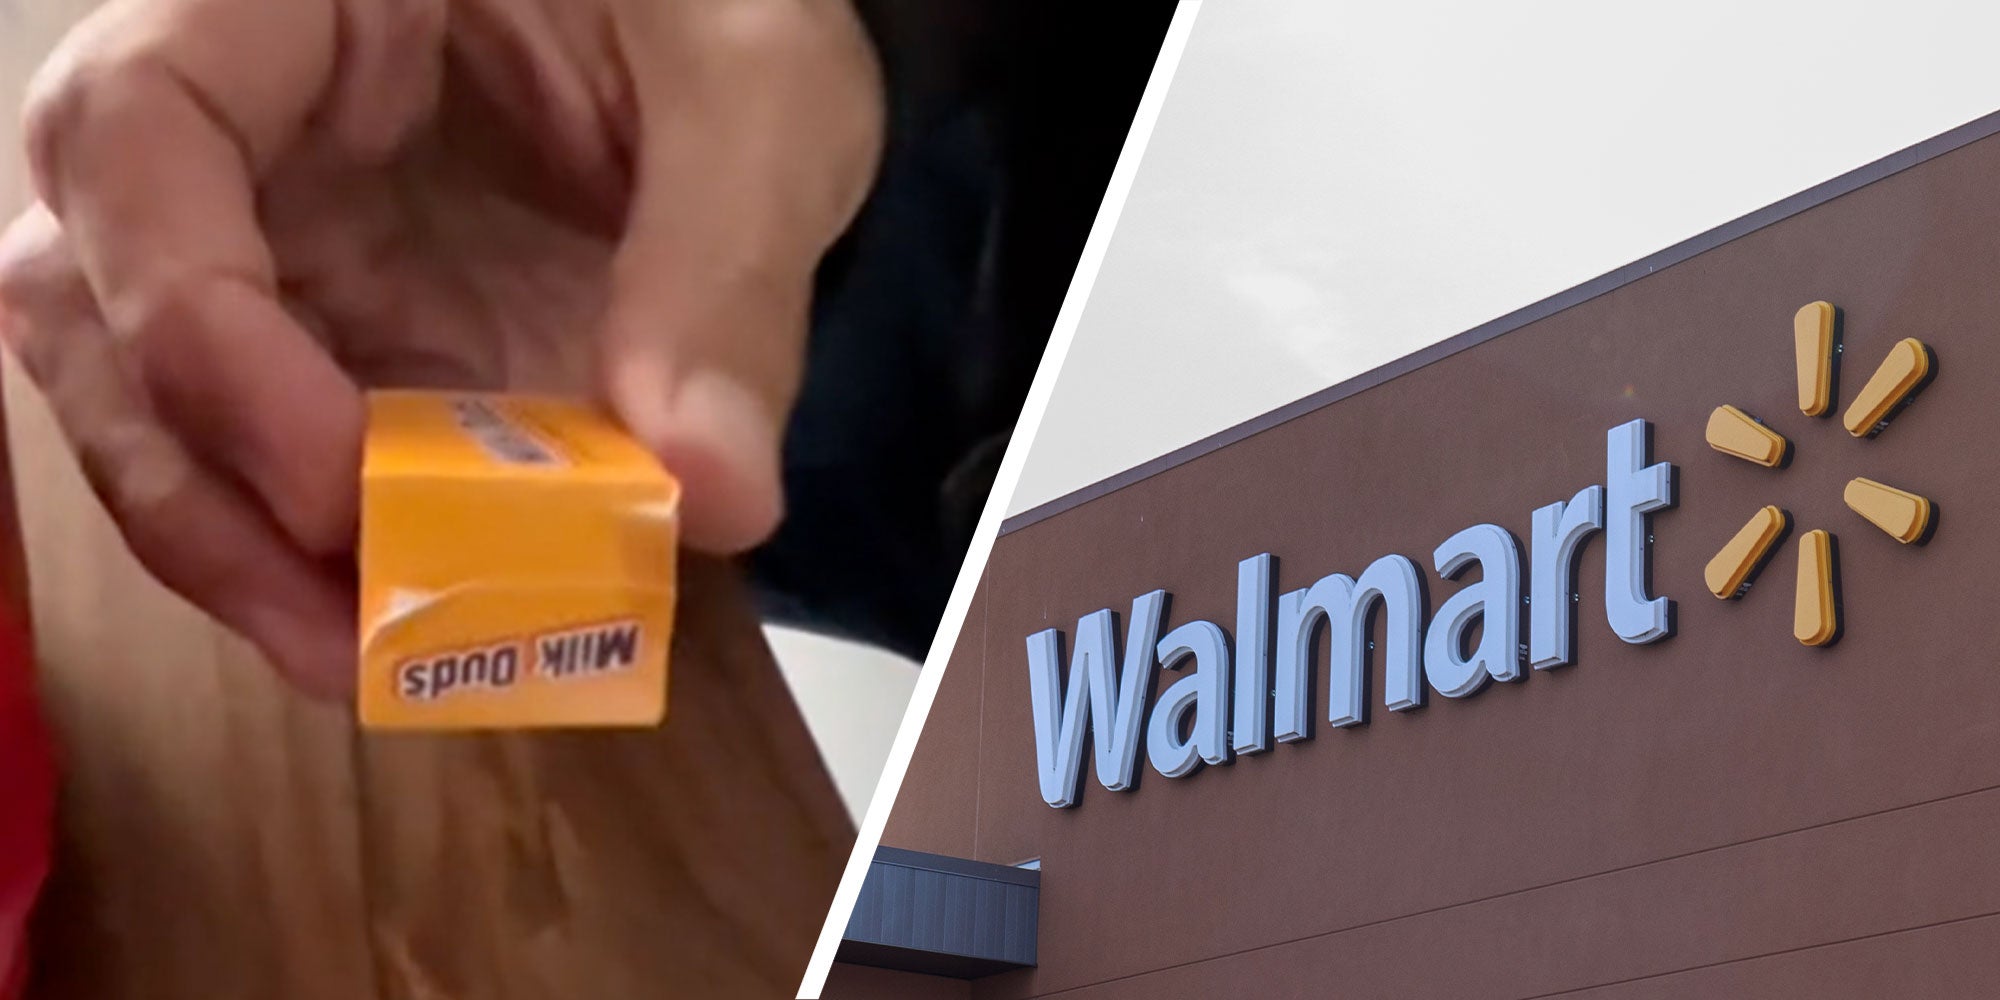


Repeat-offender products
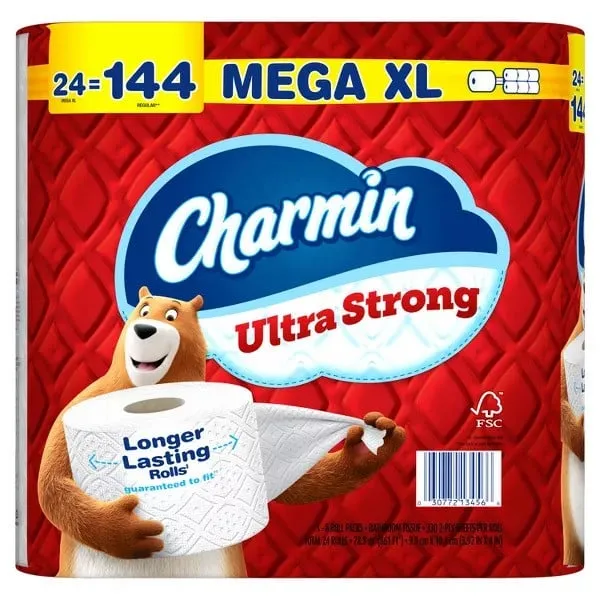
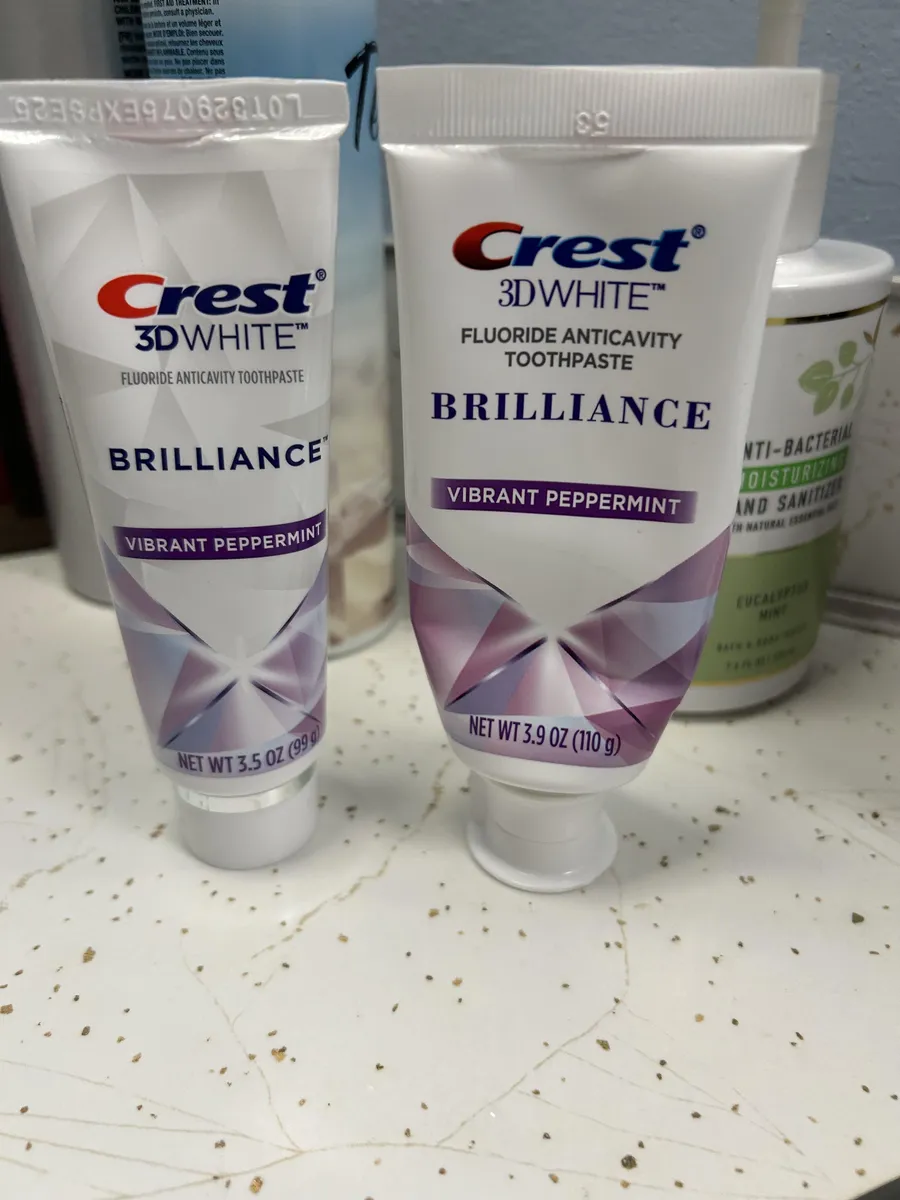
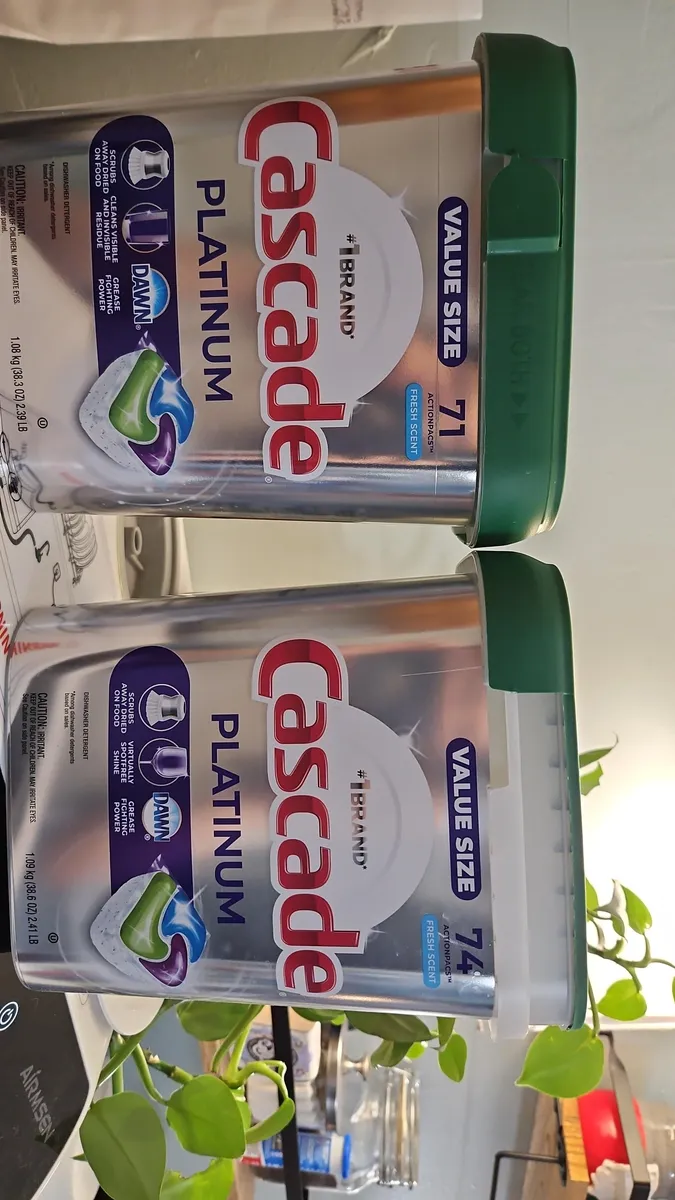
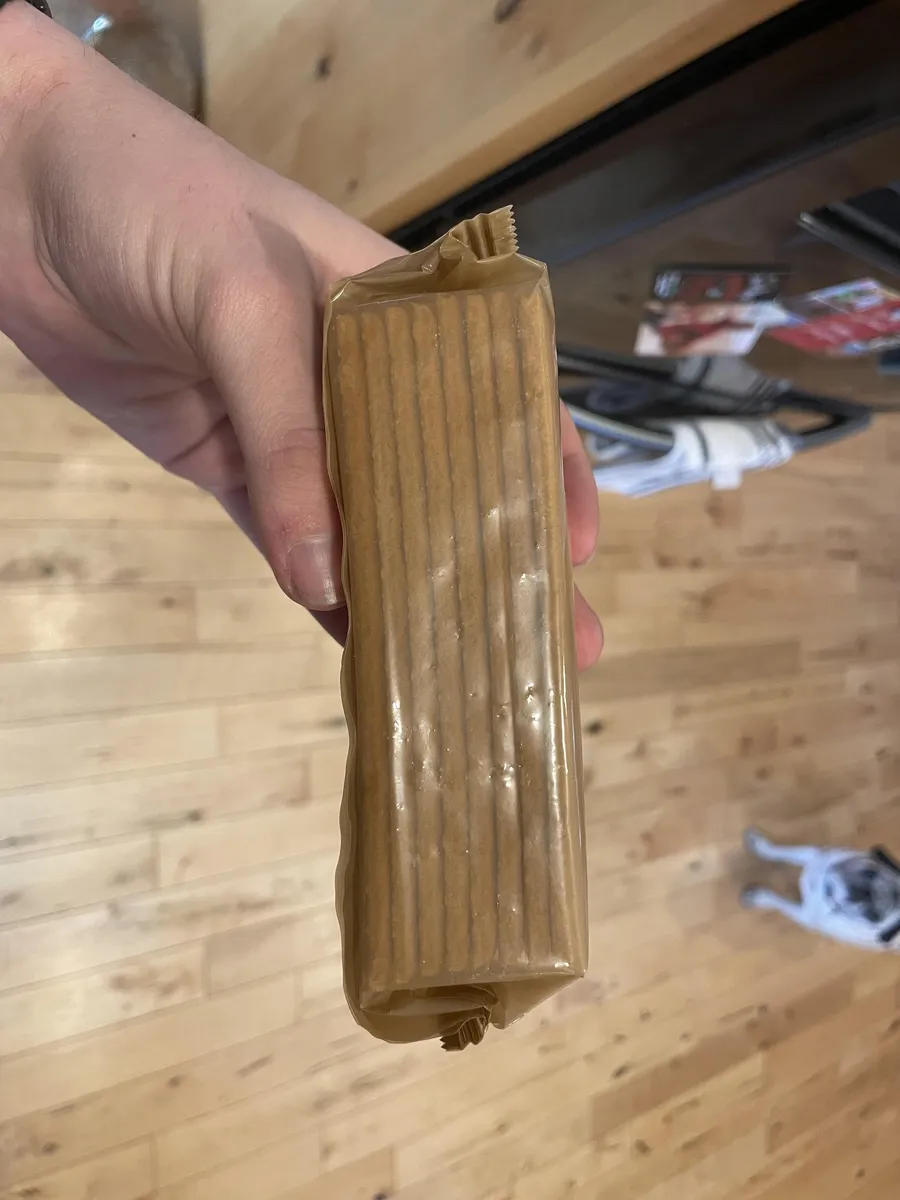
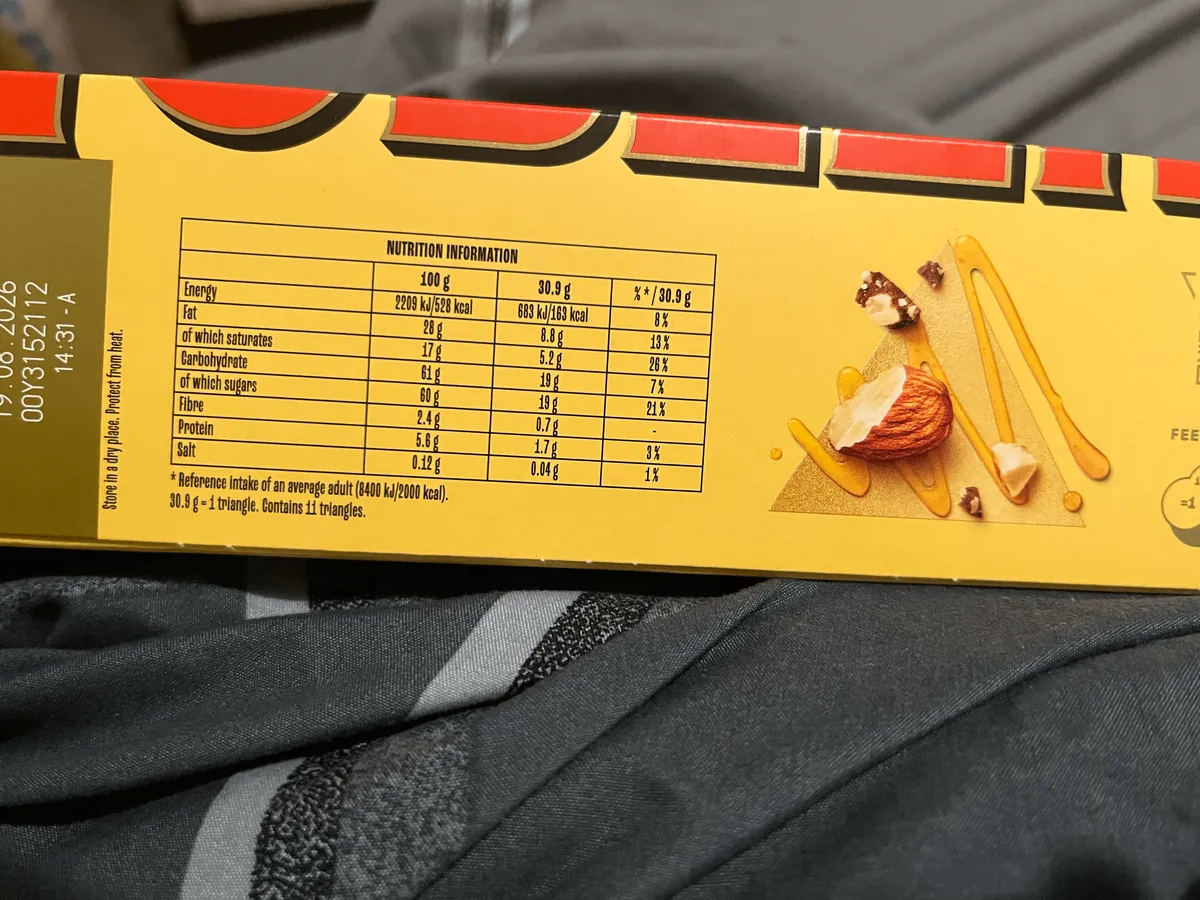
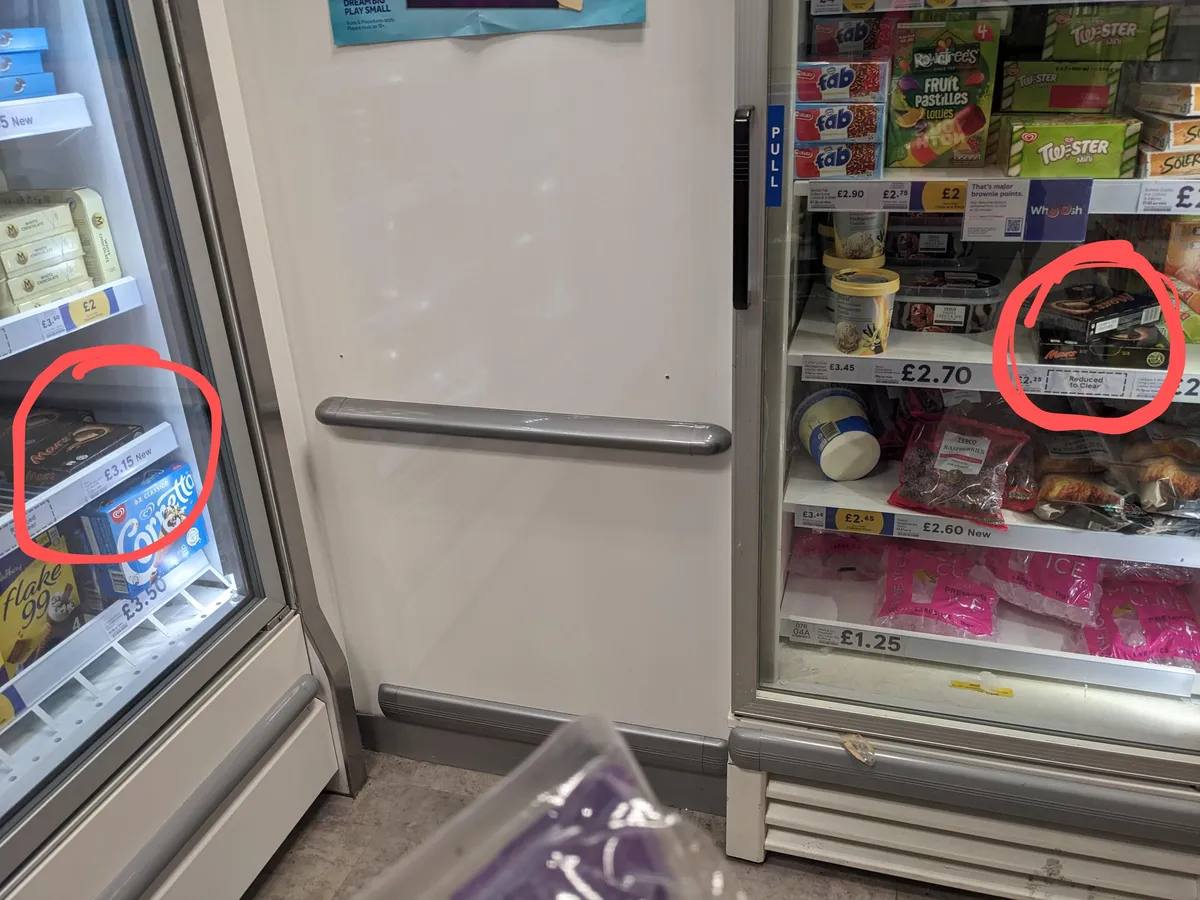
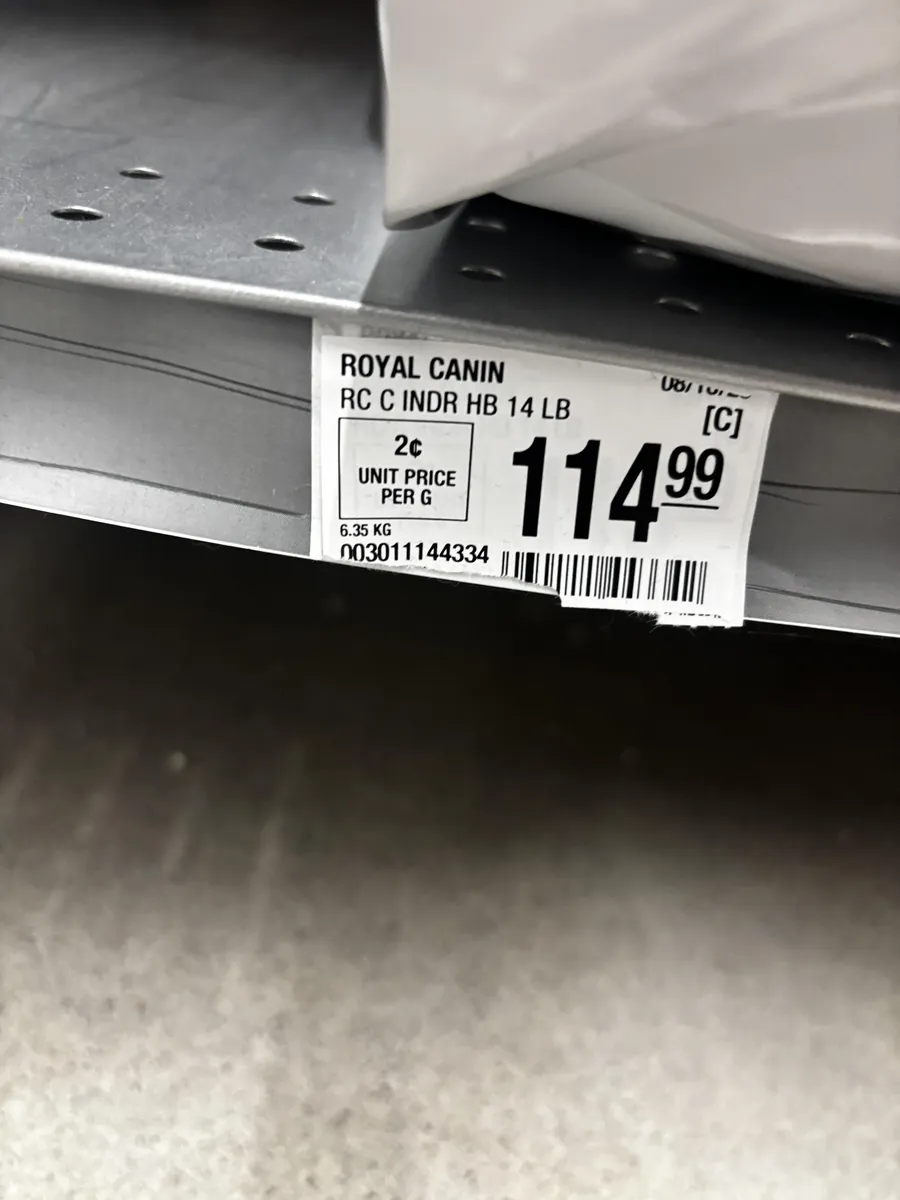
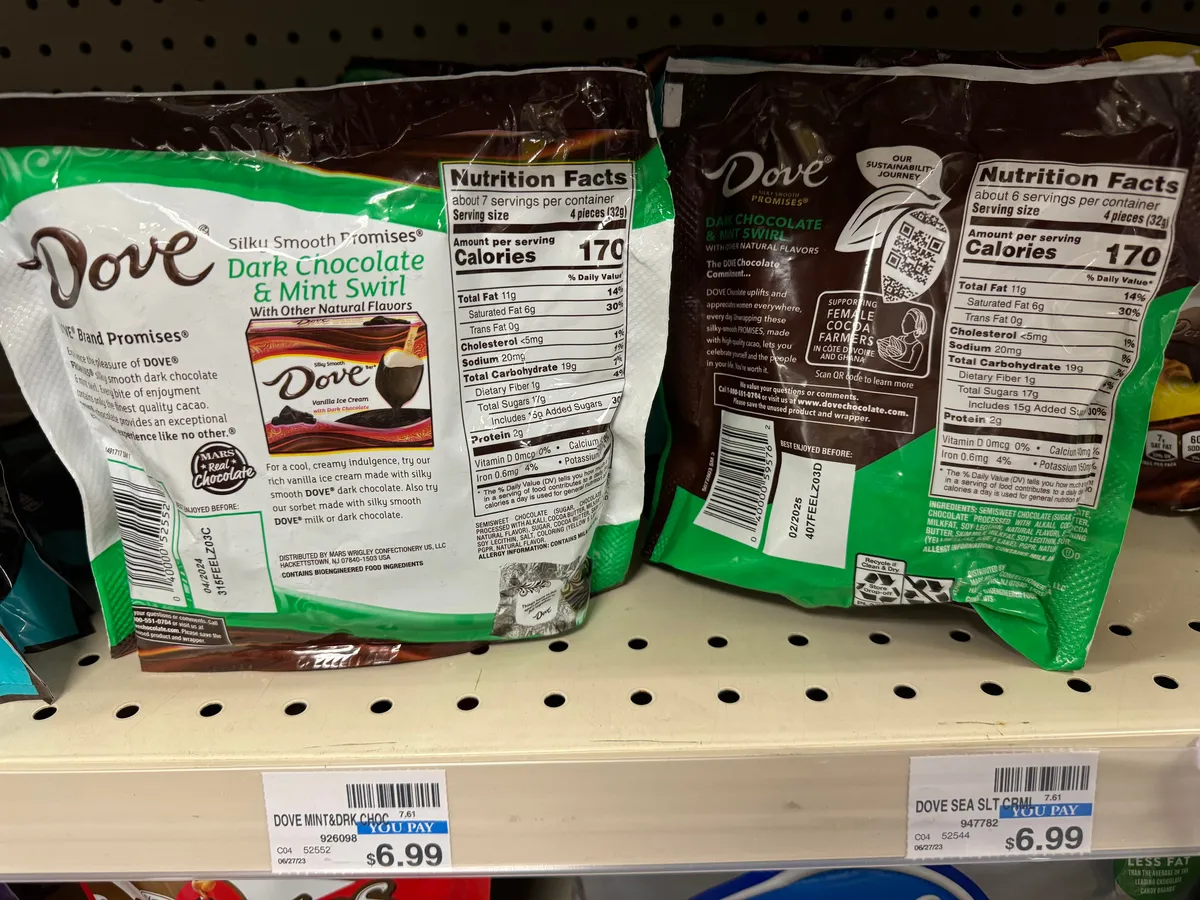
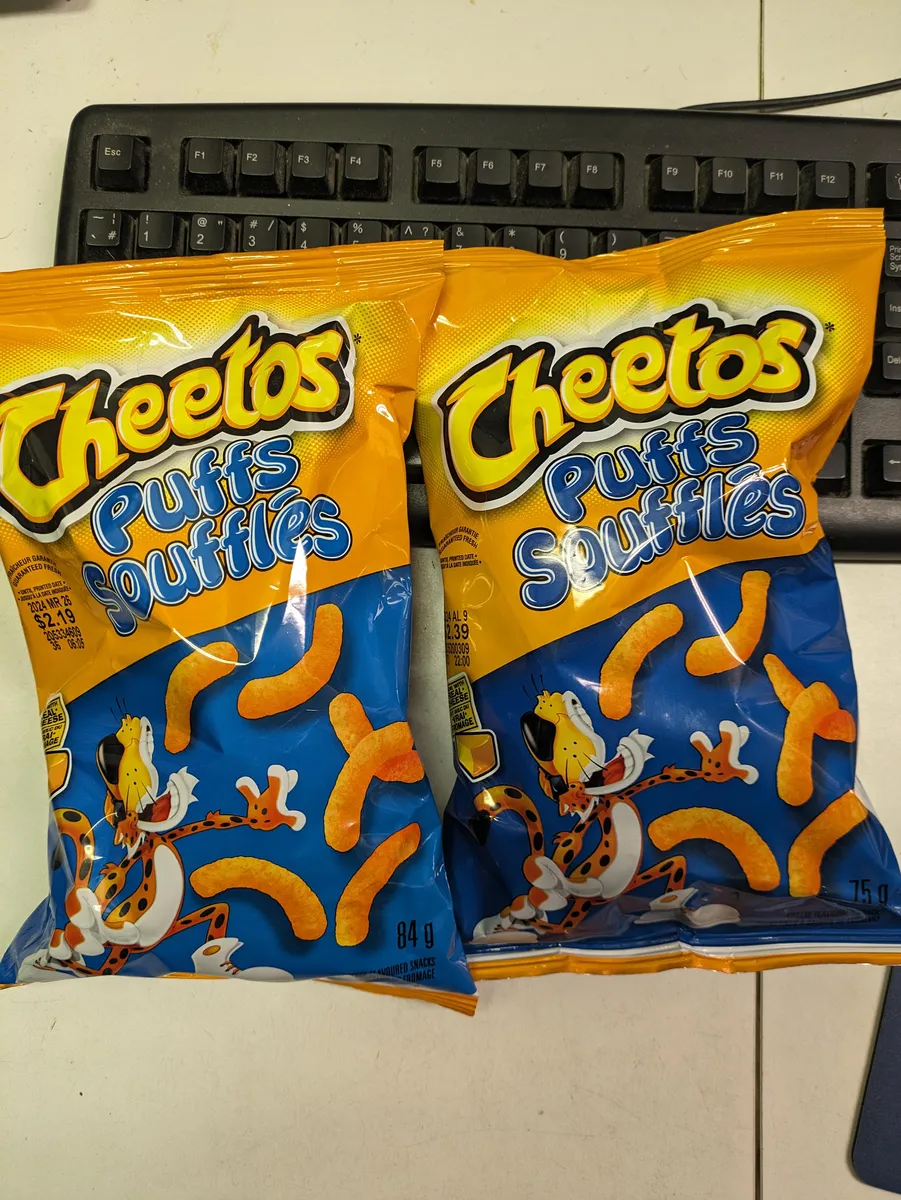
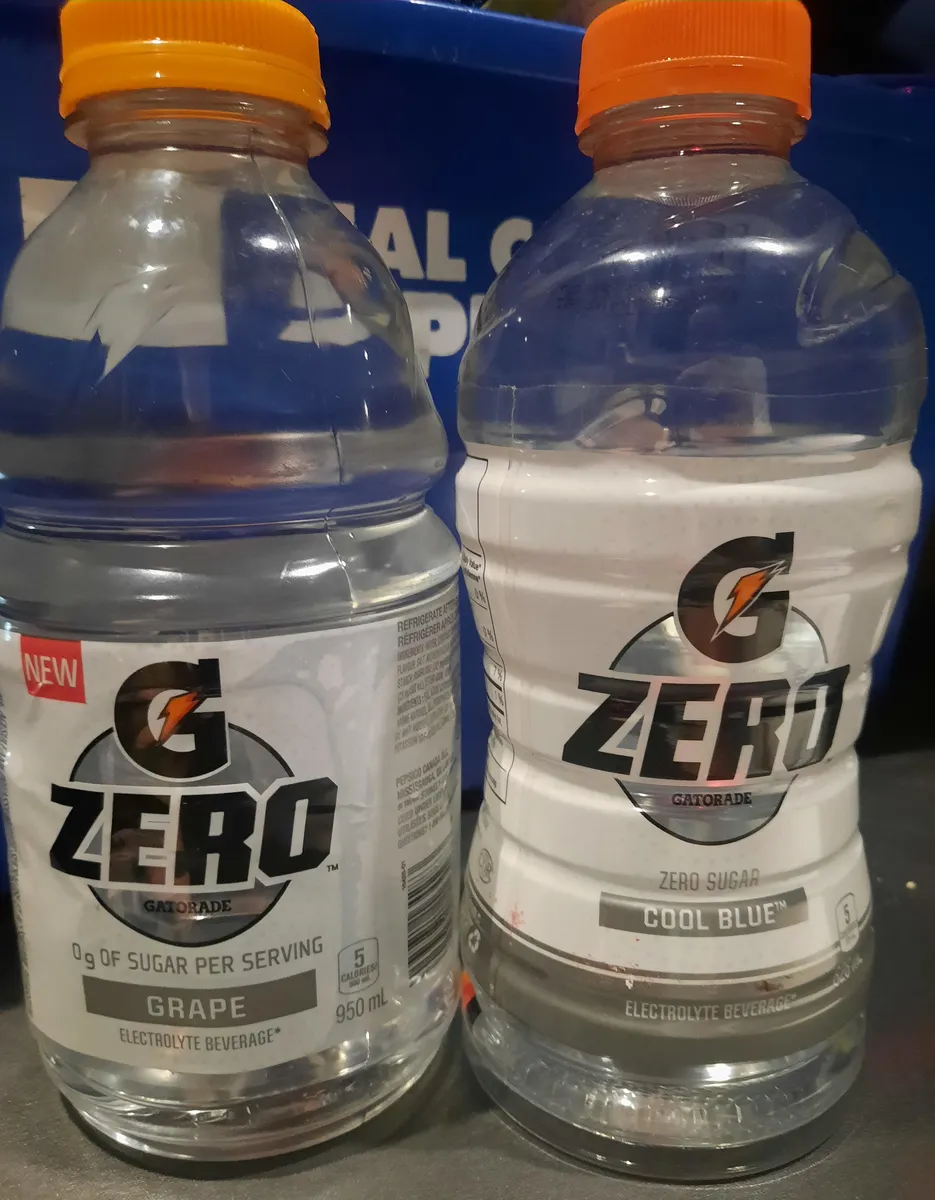
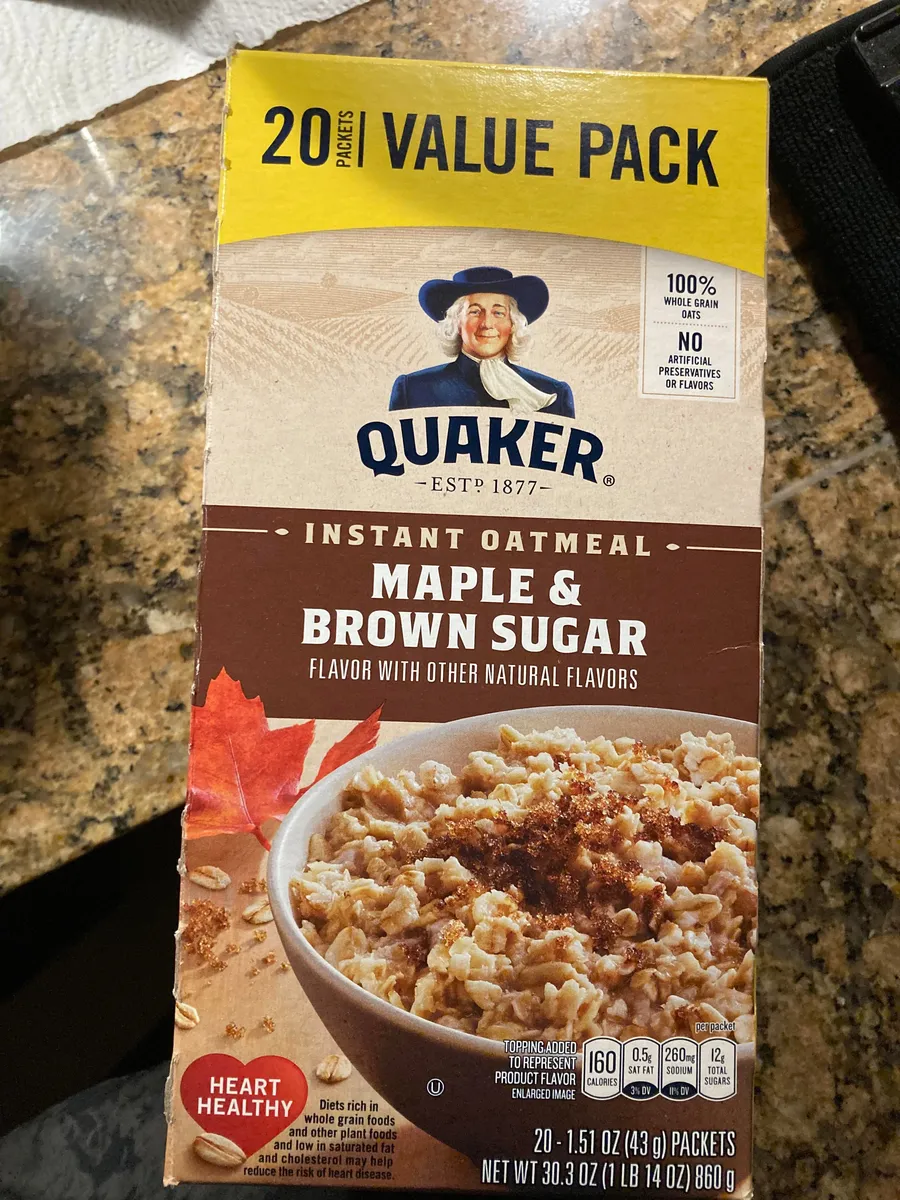
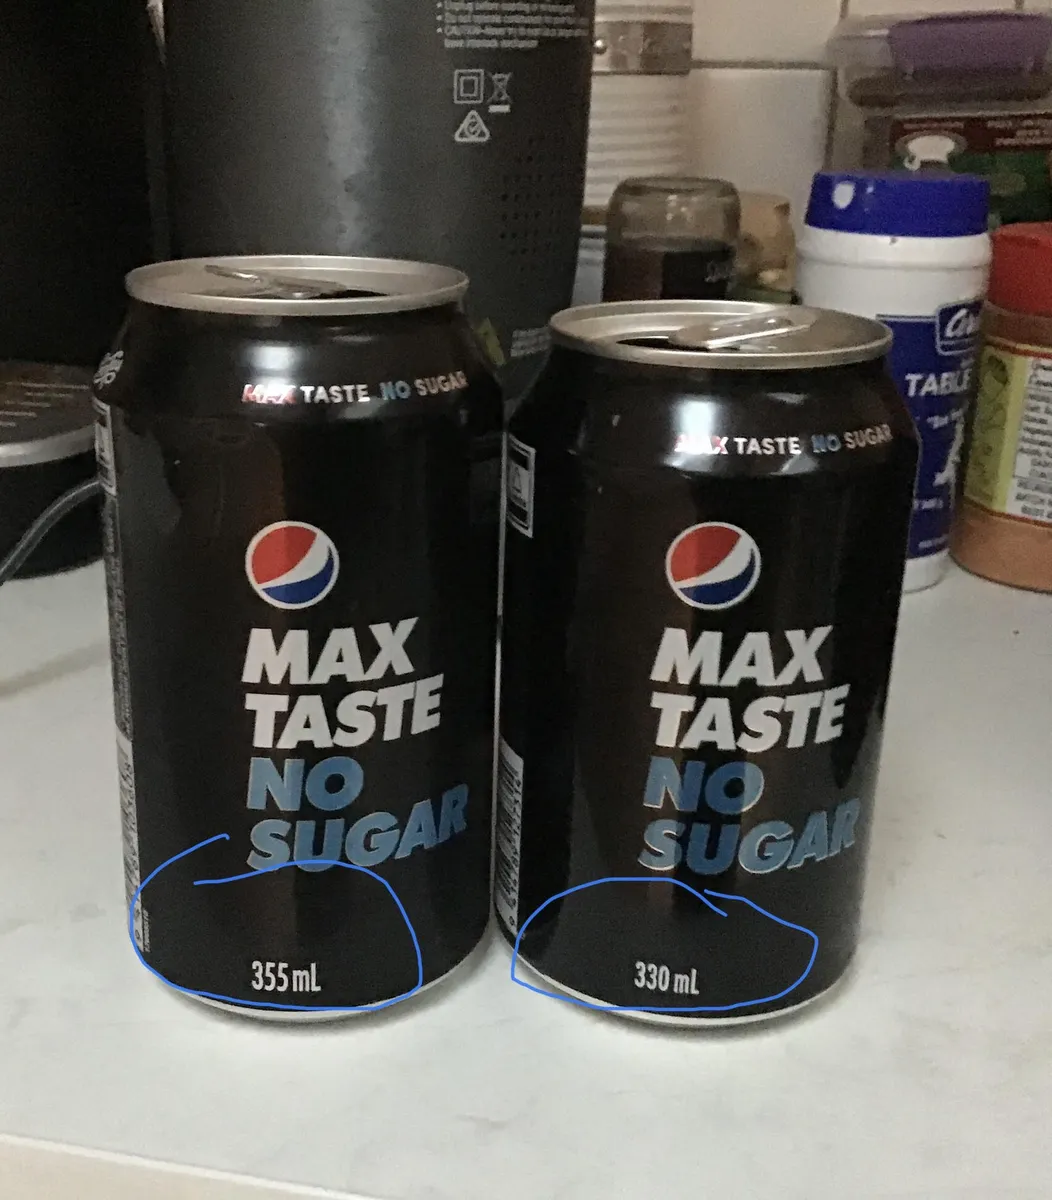
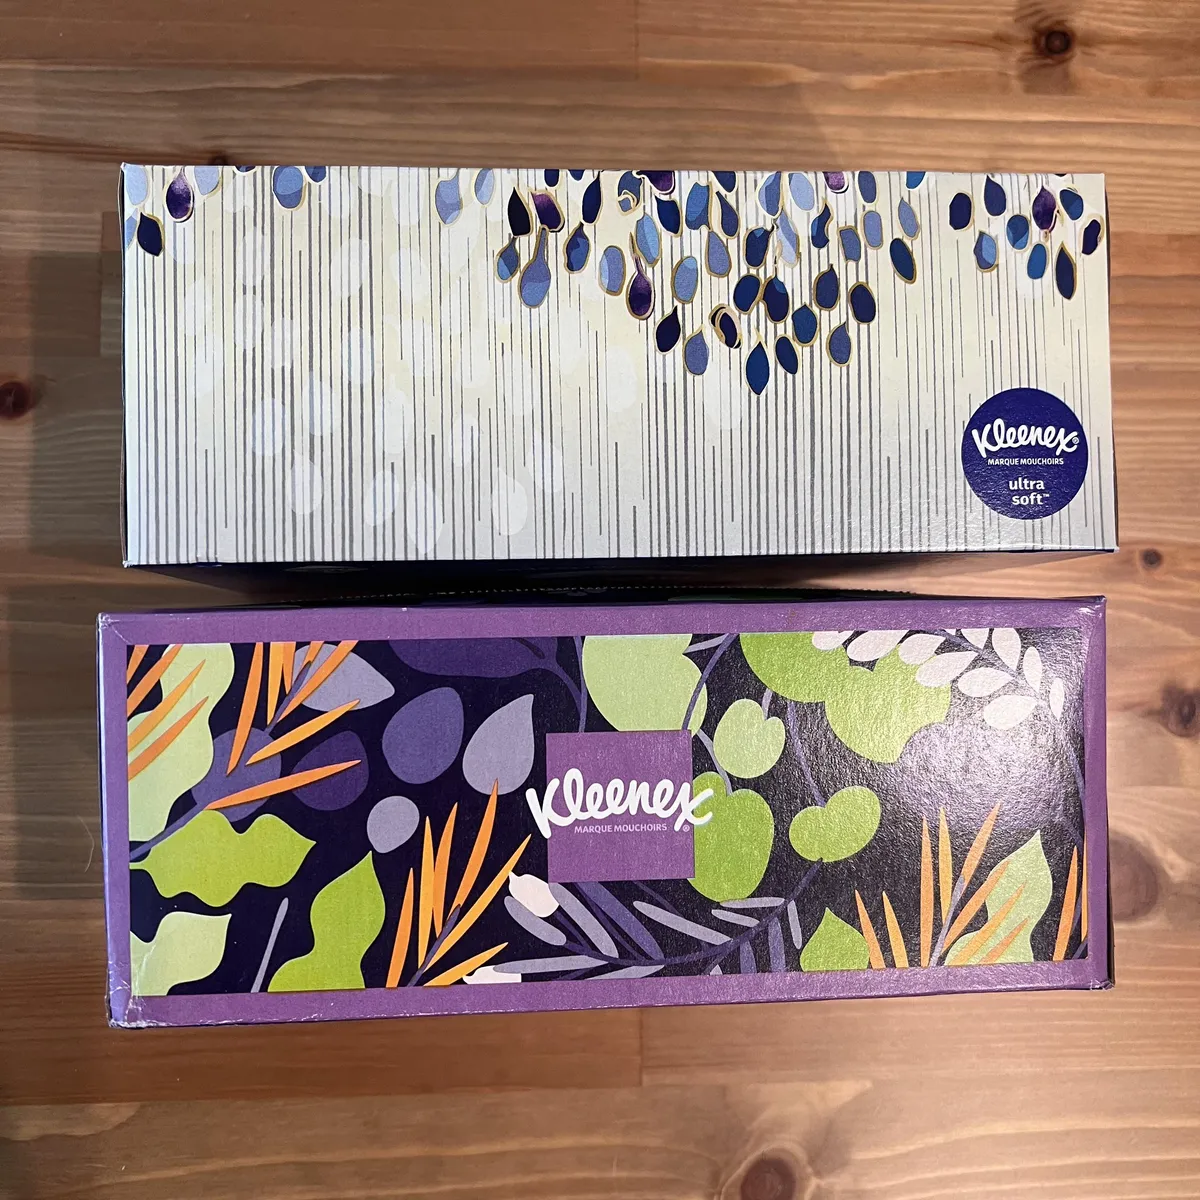
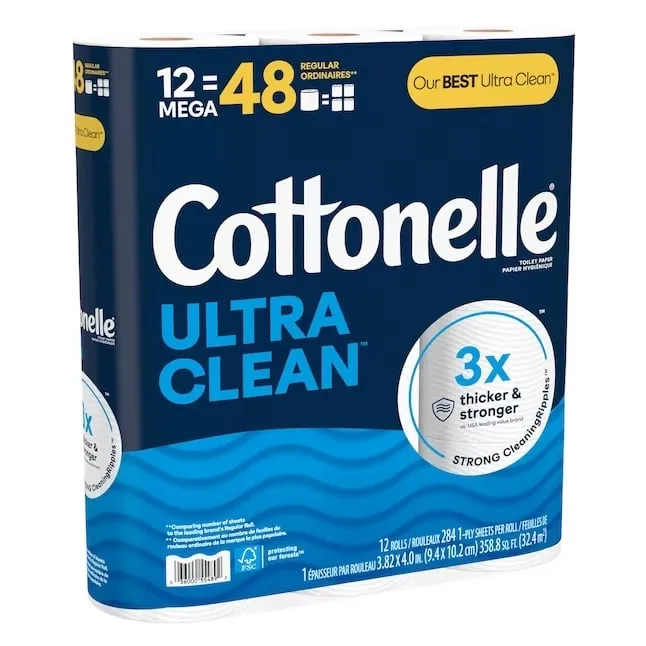
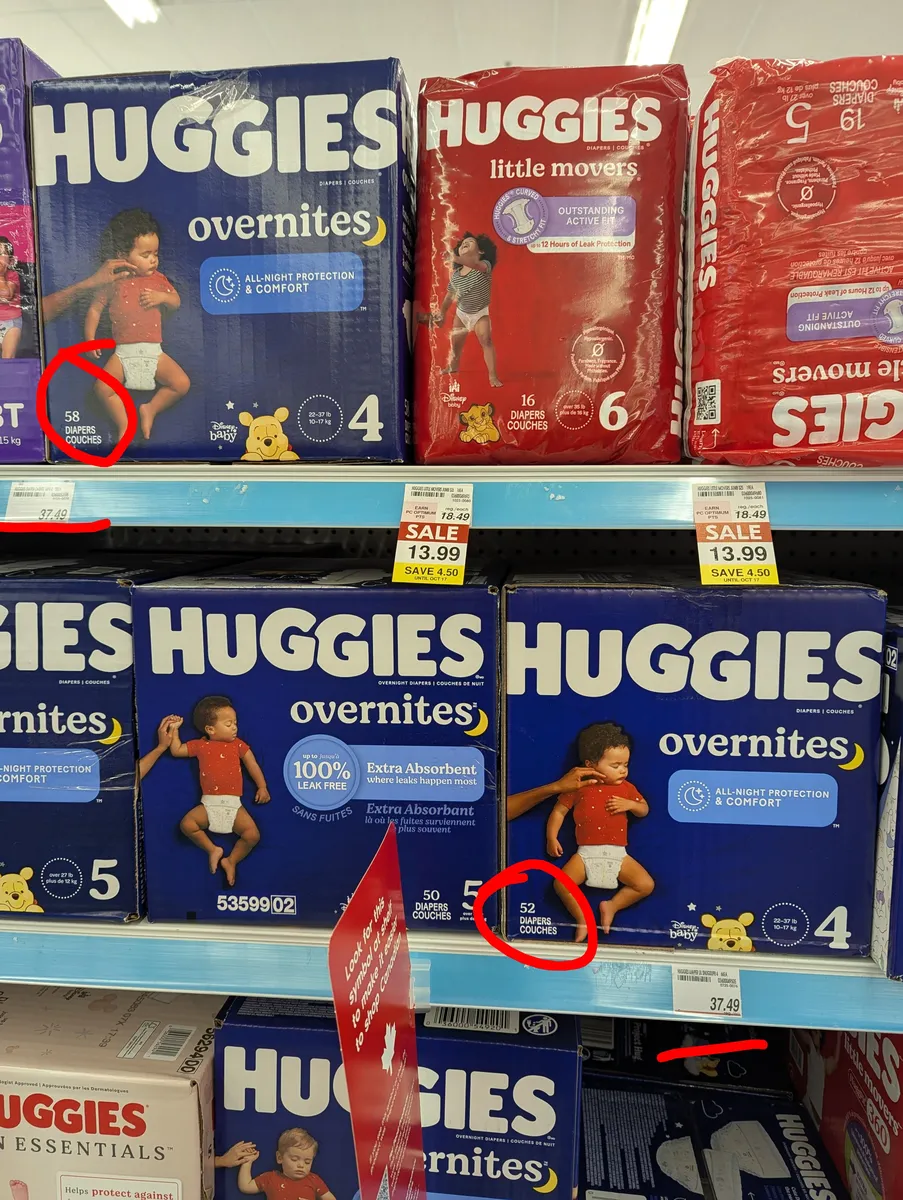
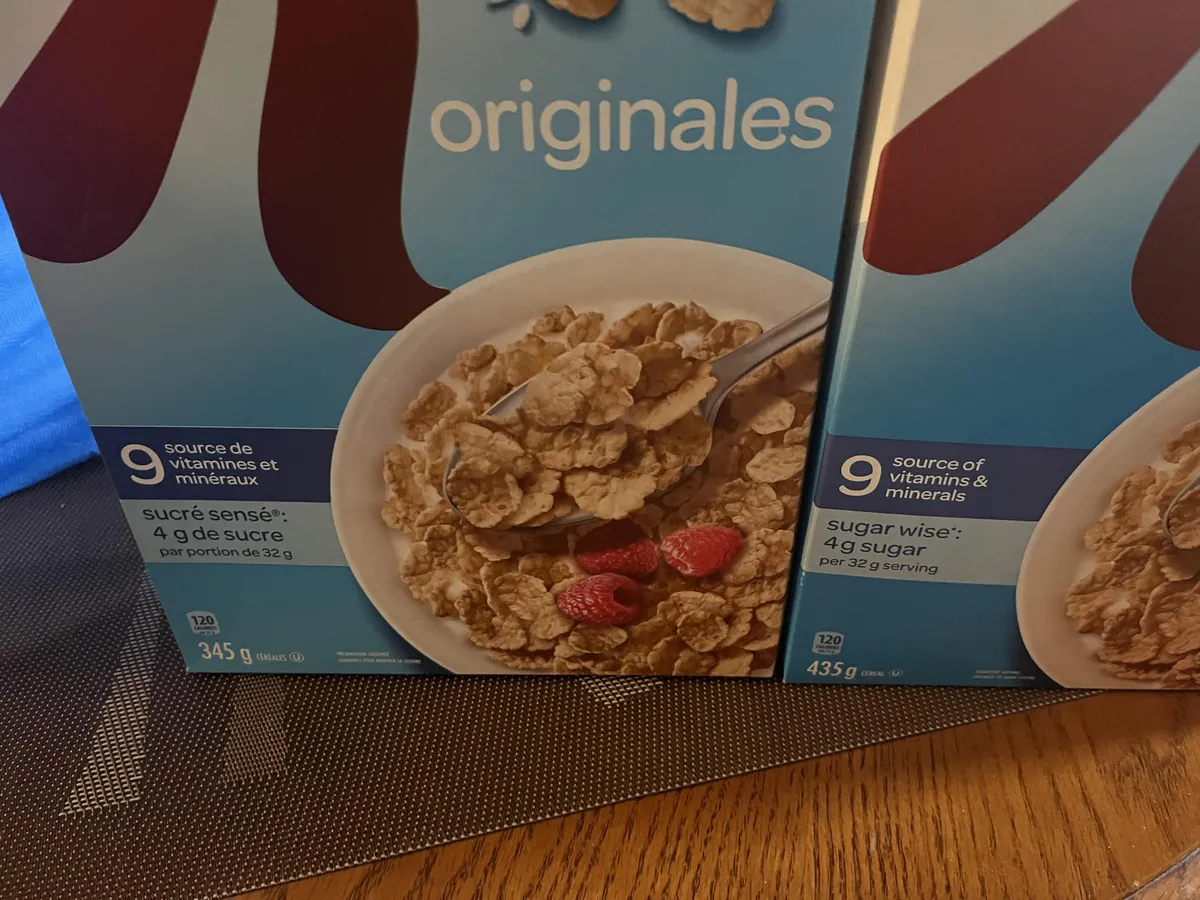
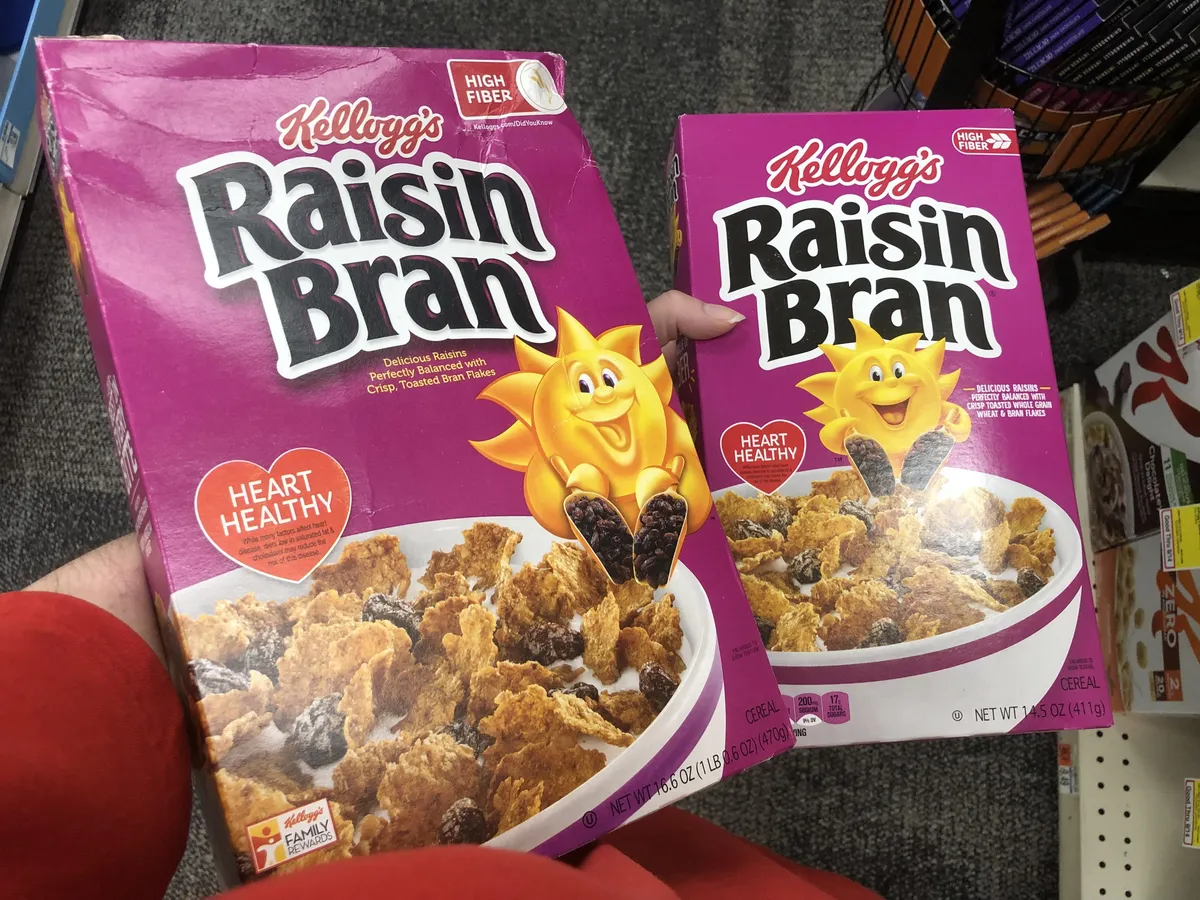
Products with the most distinct documented shrinkflation events. These aren't one-off cuts — they're a pattern.
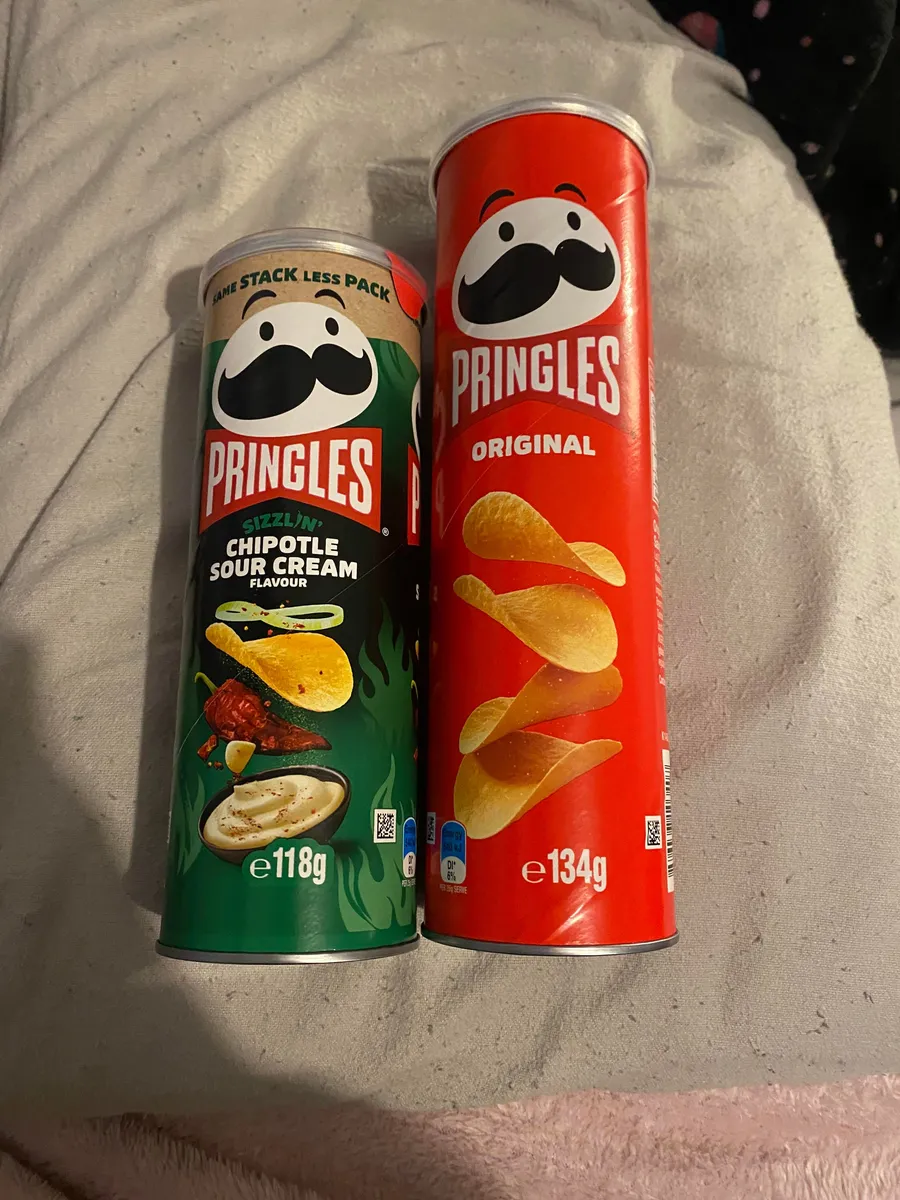
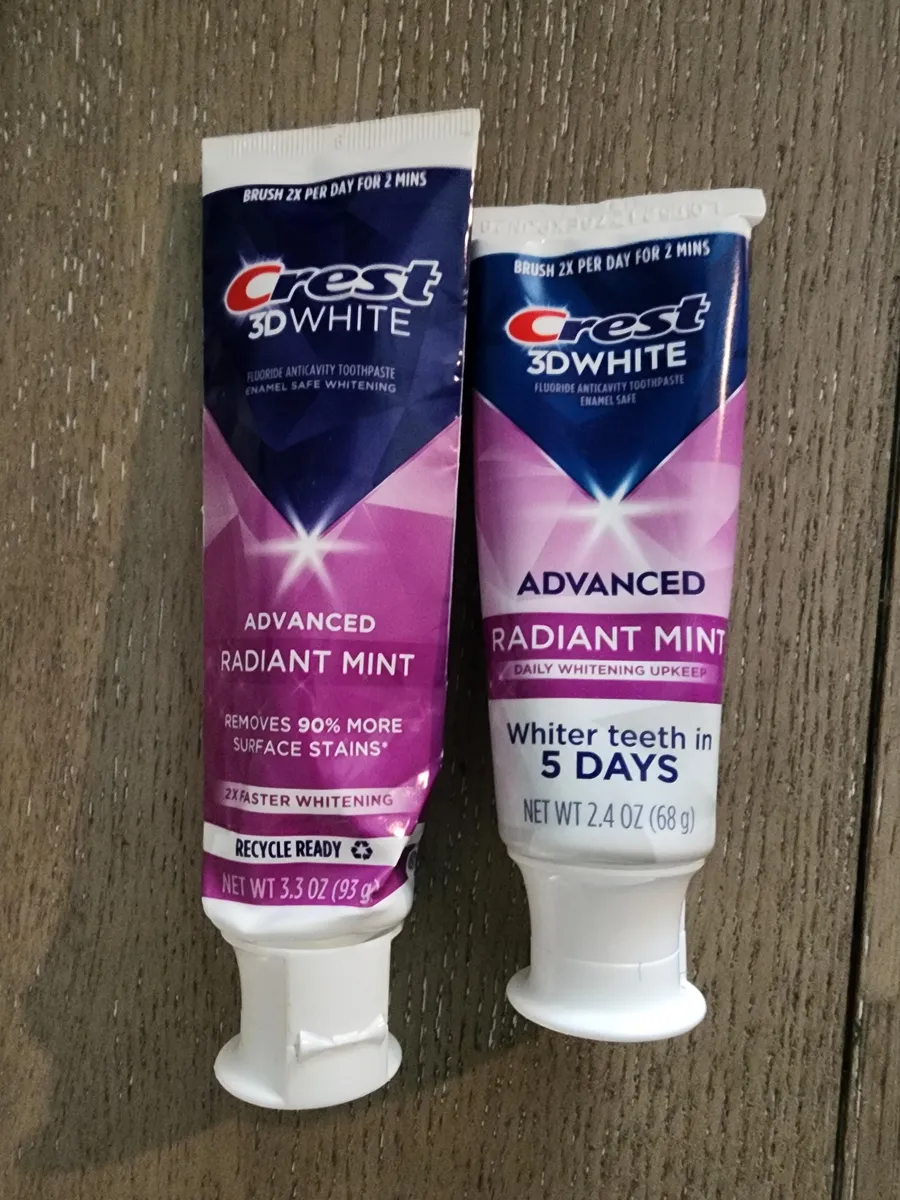
Restoration corner
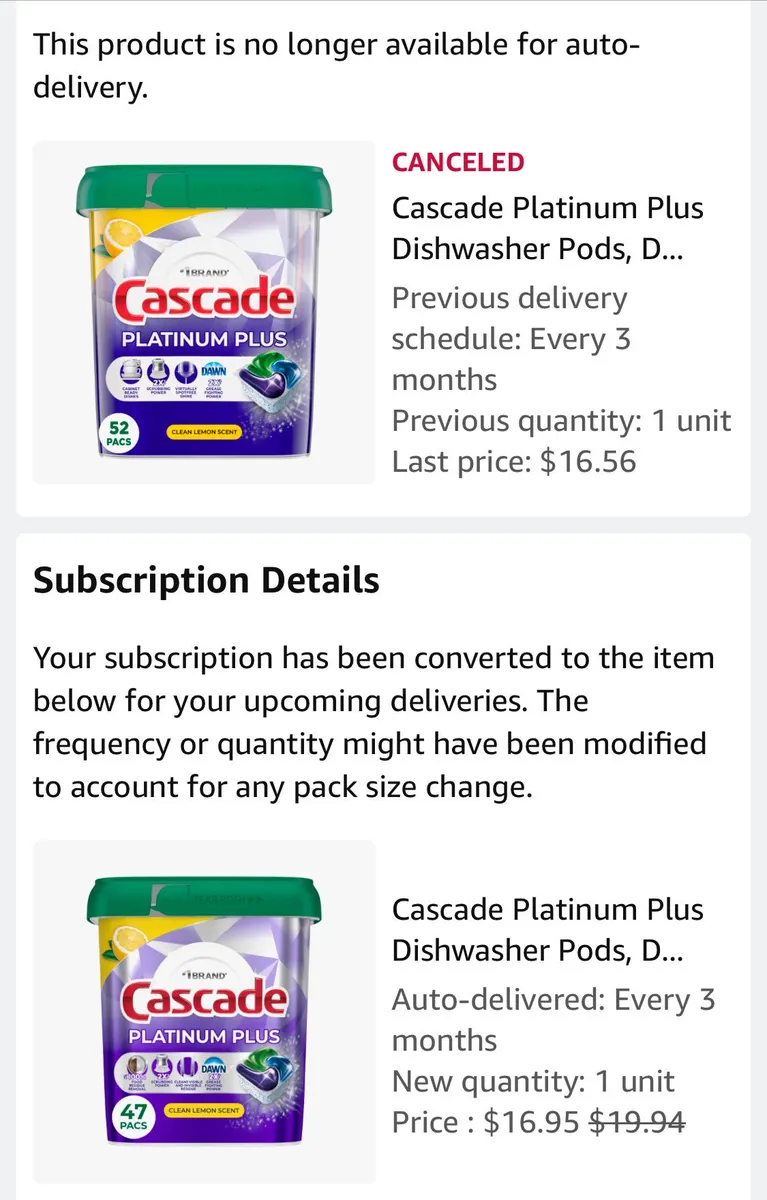
Not every shrink stays shrunk. These products got their size restored — either as a deliberate brand response to negative coverage, or as part of a packaging redesign that reverted earlier downsizing.
In the news
Spot the difference
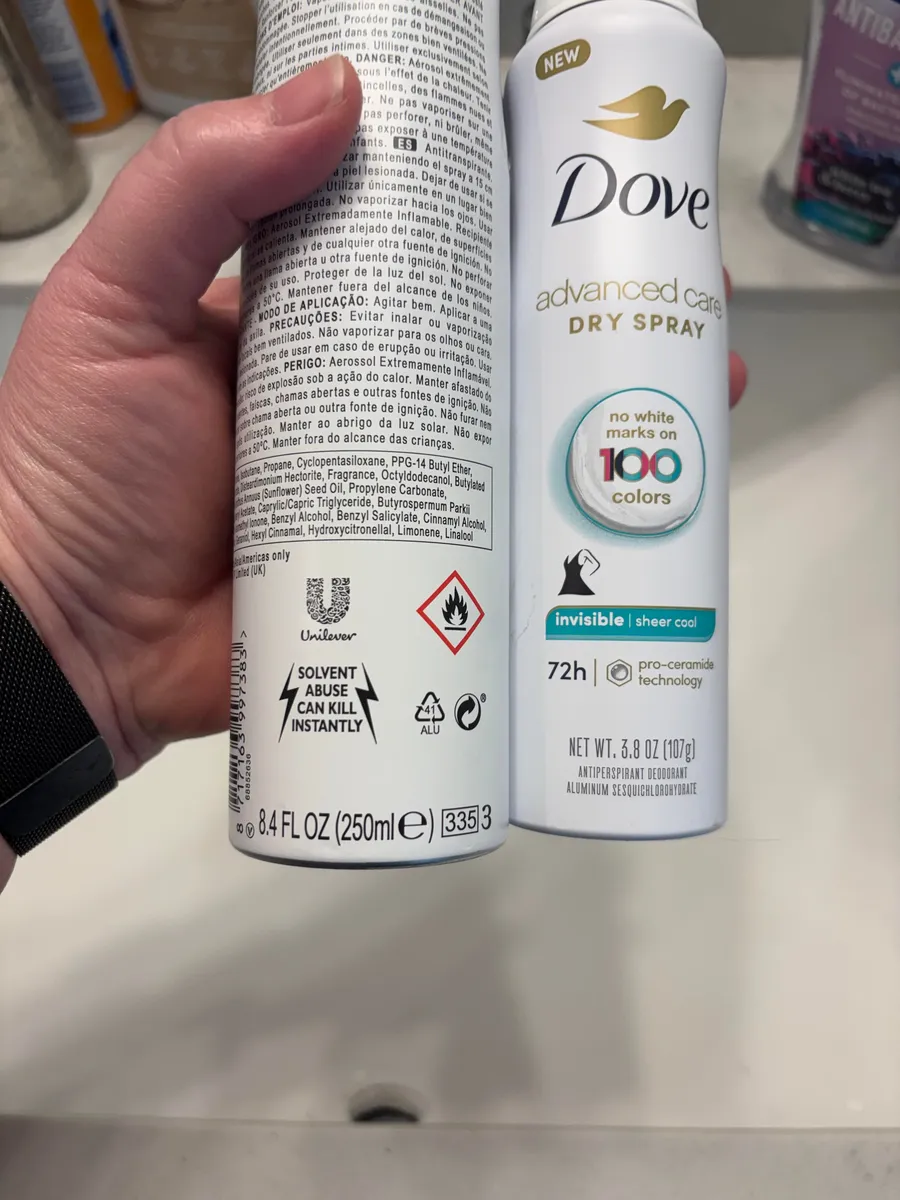
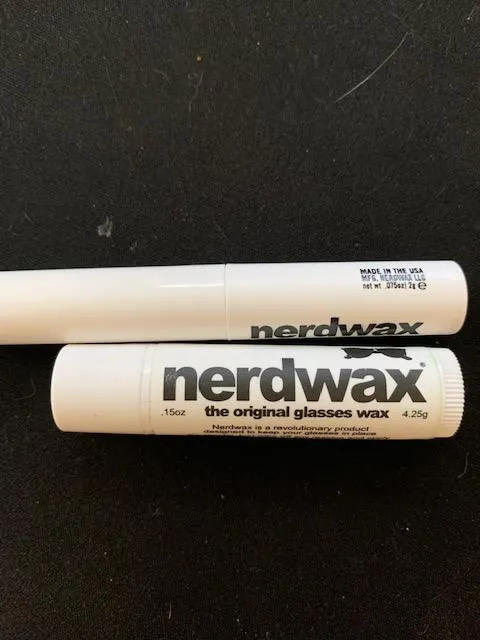
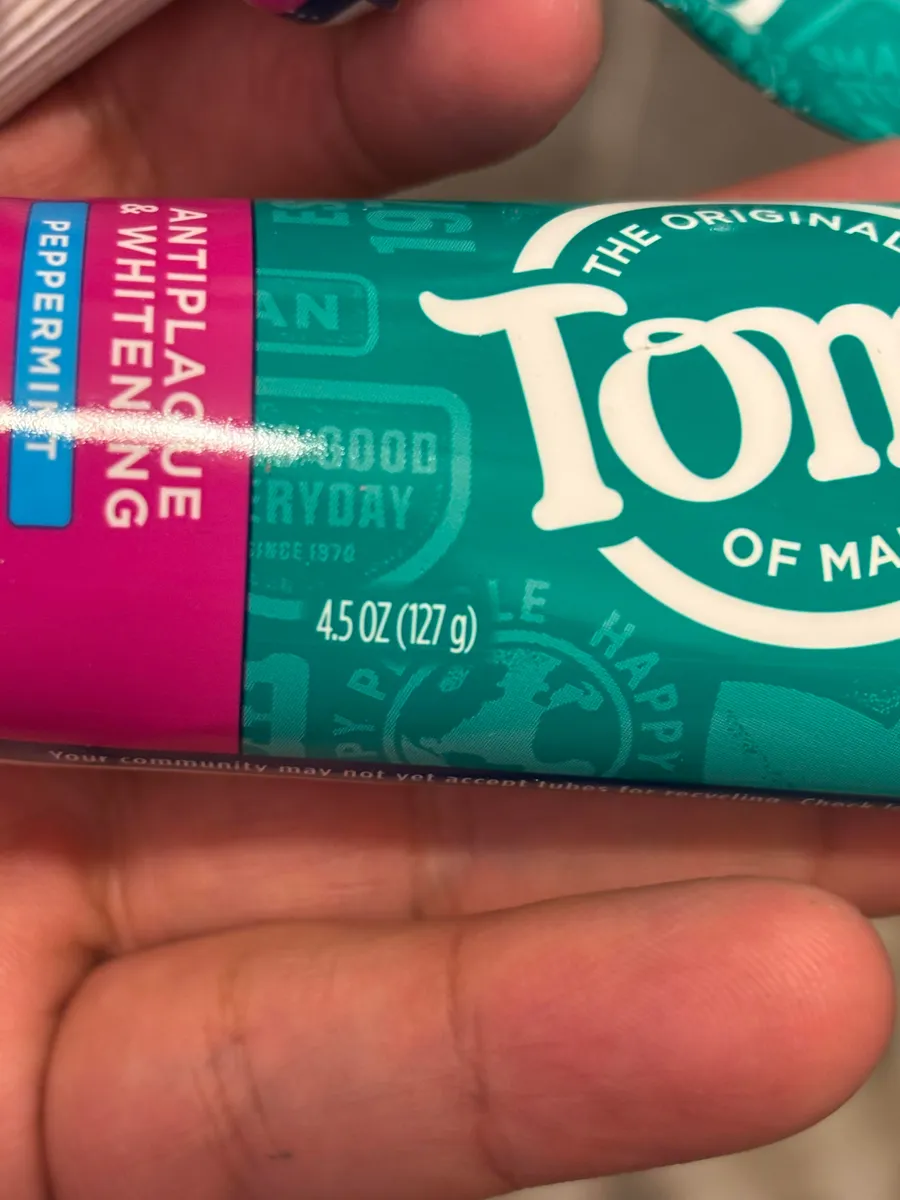
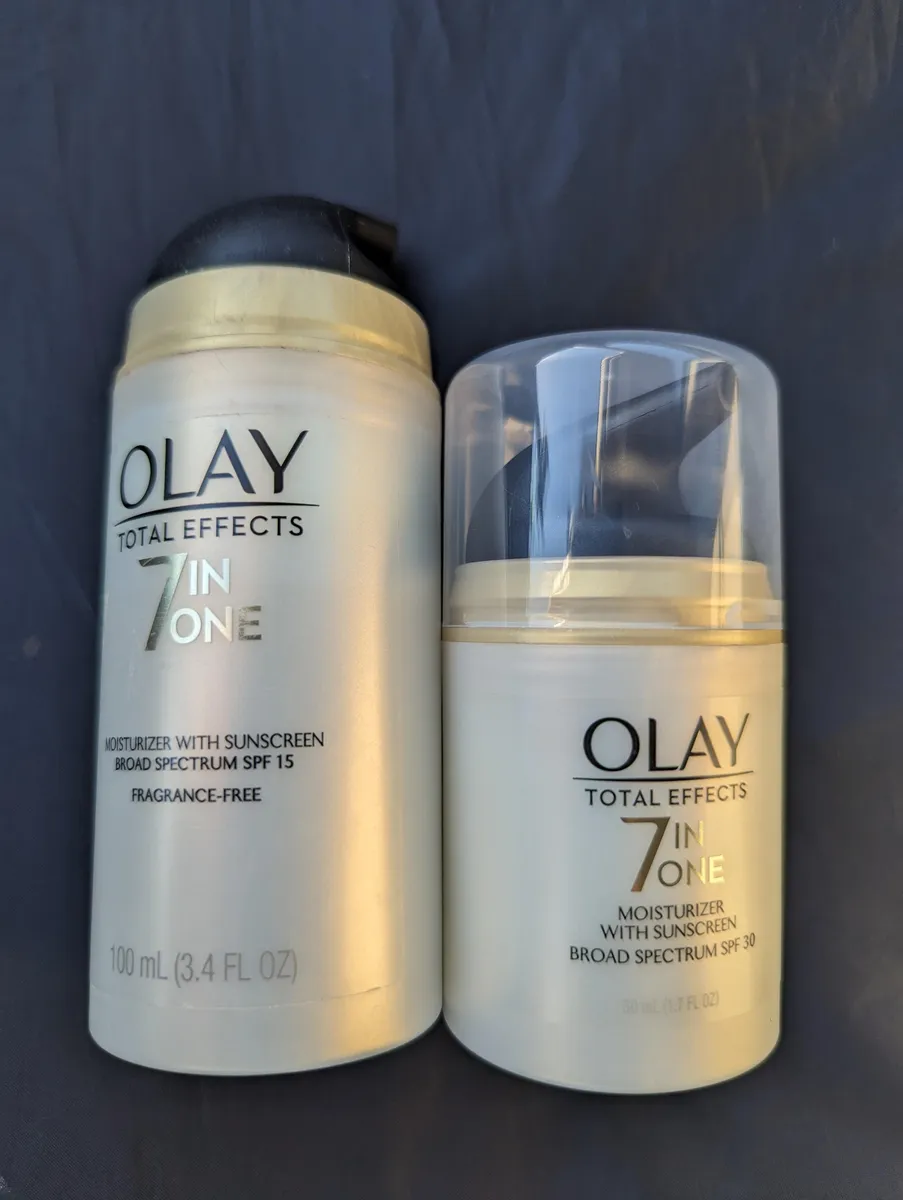
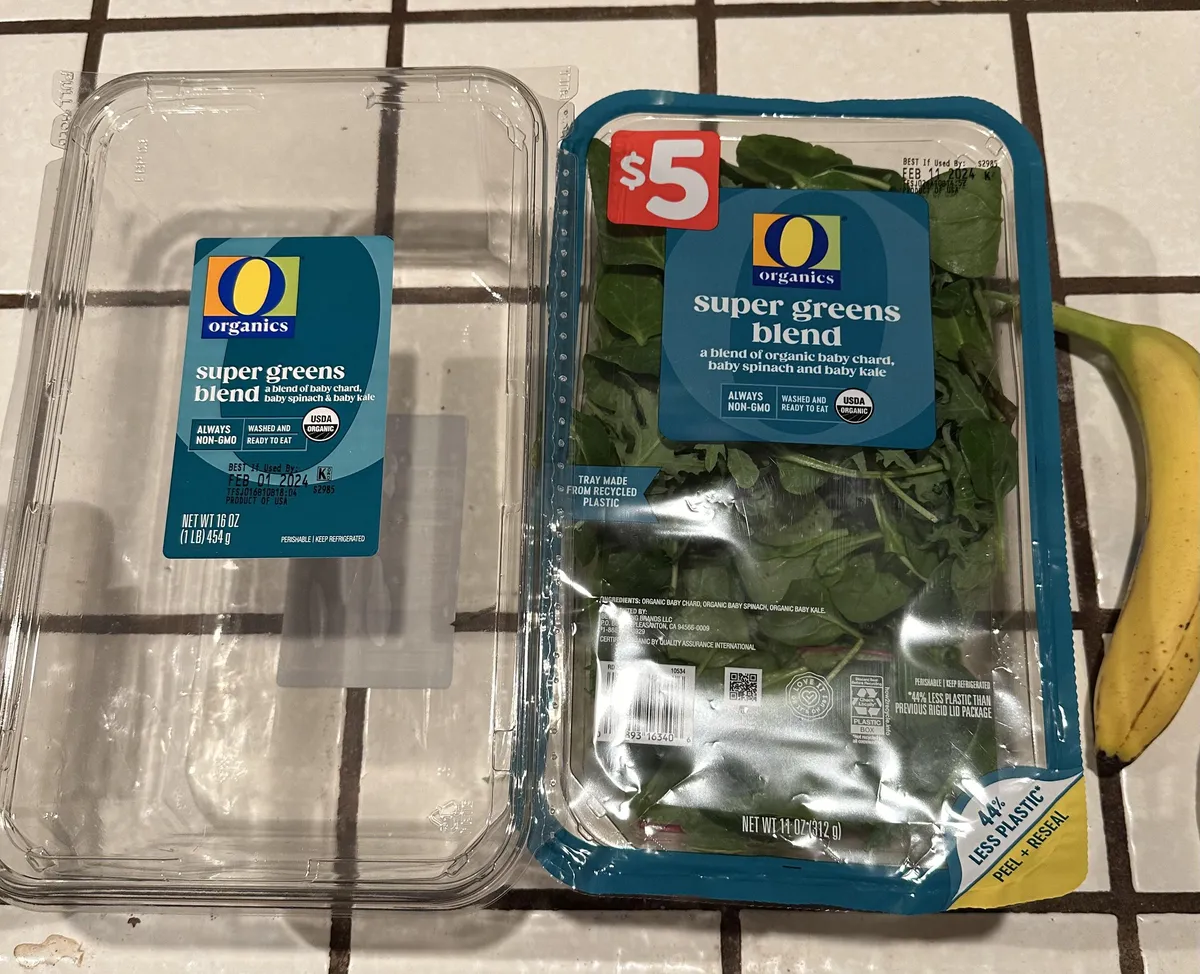
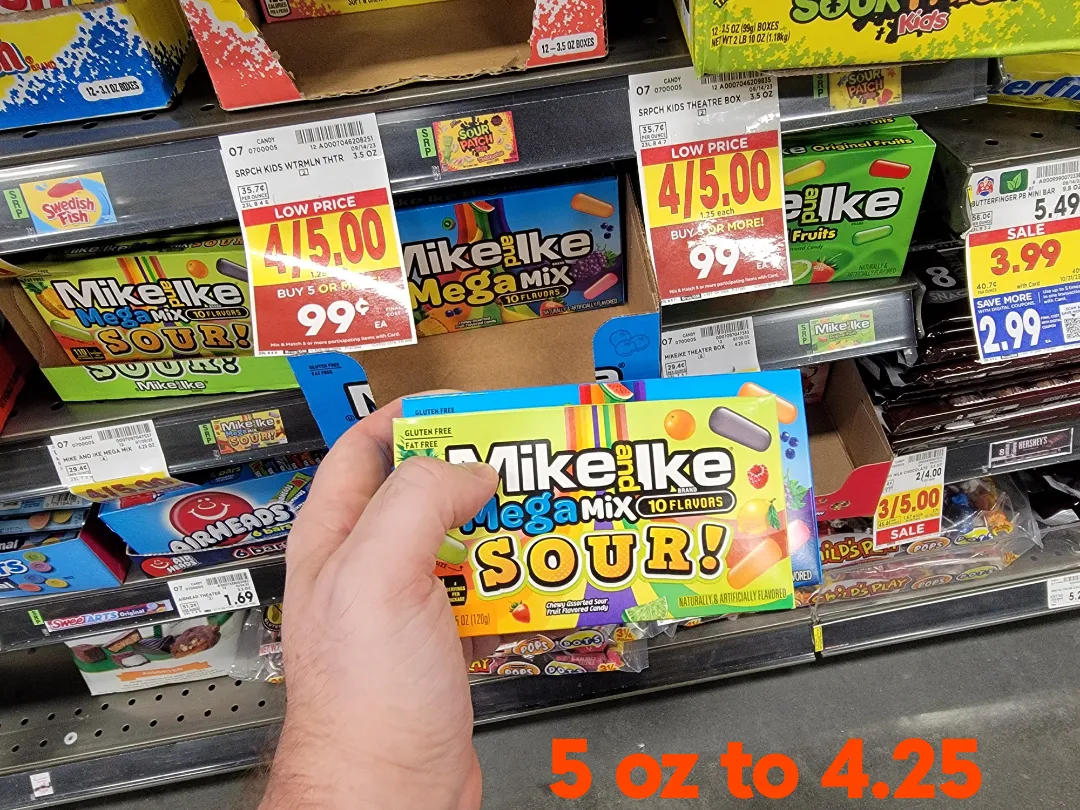
Hand-selected side-by-side comparisons where the size change is visually verifiable from a single photo or shelf observation. The full evidence trail lives on each product's page.


